笔记列表:
ArangoDB-案例场景示例
在本章中,我们将考虑两个示例场景。这些示例更容易理解,并将帮助我们理解ArangoDB功能的工作方式。
为了演示这些api,ArangoDB预先加载了一组易于理解的图形。有两种方法可以在ArangoDB中创建这些图的实例−
- 在web界面的“创建图形”窗口中添加“示例”选项卡,
- or load the module @arangodb/graph示例/示例图 in Arangosh.
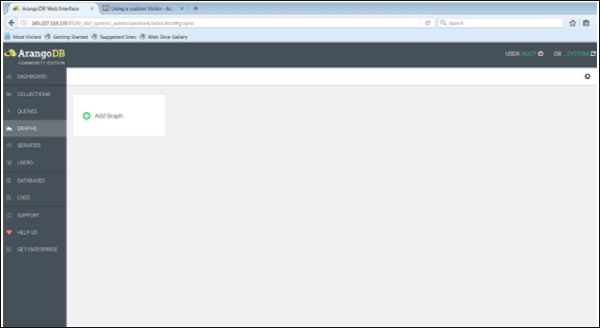
To start with, let us load a graph with the help of web interface. For that, launch the web interface and click on the 图 tab.
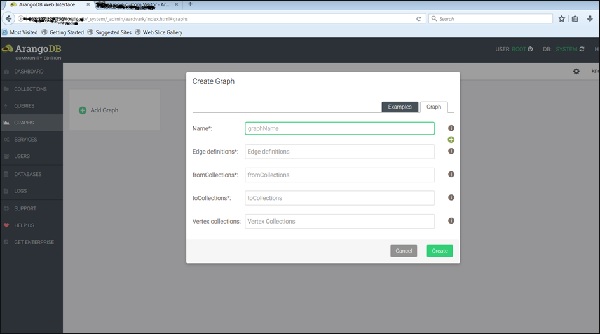
The 创建图形 dialog box appears. The Wizard contains two tabs – 示例 and 图形. The 图形 tab is open by default; supposing we want to create a new graph, it will ask for the name and other definitions for the graph.
Now, we will upload the already created graph. For this, we will select the 示例 tab.
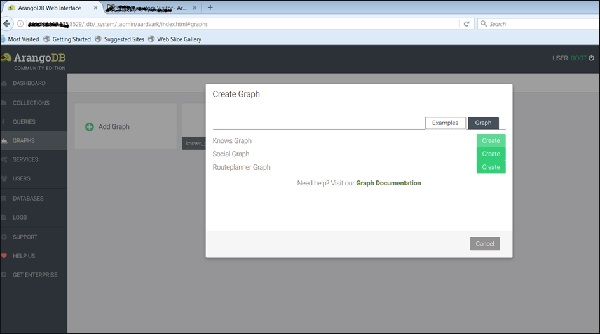
We can see the three example graphs. Select the 图 and click on the green button Create.
一旦你创建了它们,你就可以在网页界面中查看它们了——这个界面是用来创建下面的图片的。
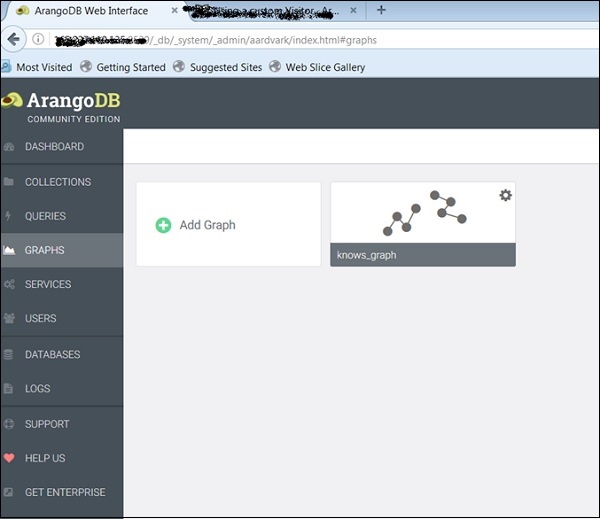
U图
Let us now see how the 图 works. Select the Knows_Graph, and it will fetch the graph data.
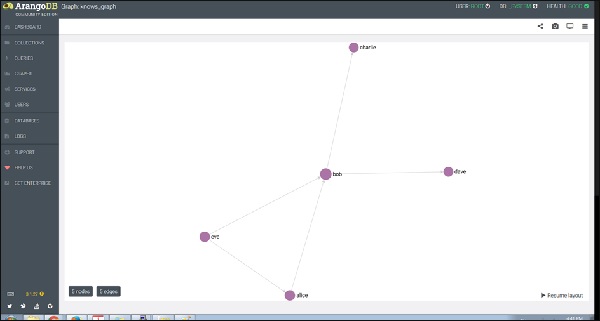
The Knows_Graph consists of one vertex collection 人 connected via one edge collection 知道. It will contain five persons Alice, Bob, Charlie, Dave and Eve as vertices. We will have the following directed relations
Alice knows Bob
Bob knows Charlie
Bob knows Dave
Eve knows Alice
Eve knows Bob
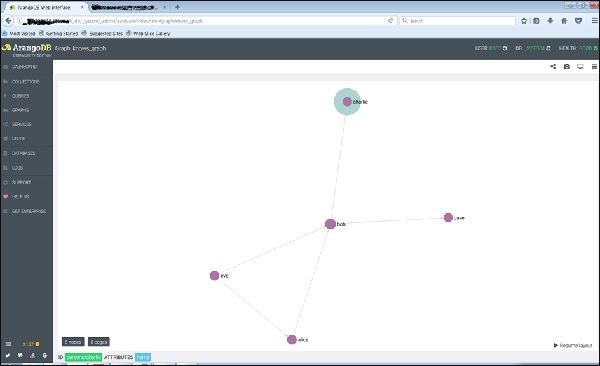
如果单击一个节点(顶点),说“bob”,它将显示ID(persons/bob)属性名。
单击任何一条边,就会显示ID(knows/4590)属性。
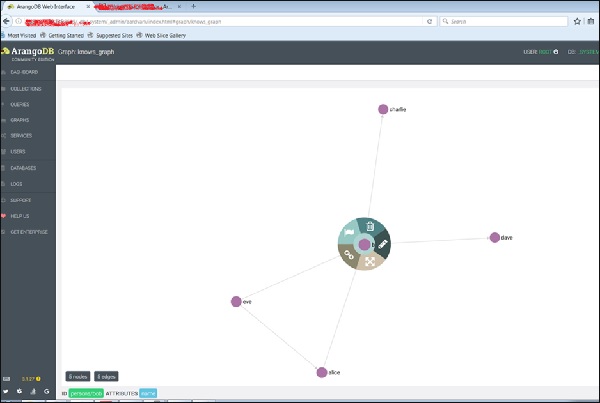
这就是我们如何创建它,检查它的顶点和边。
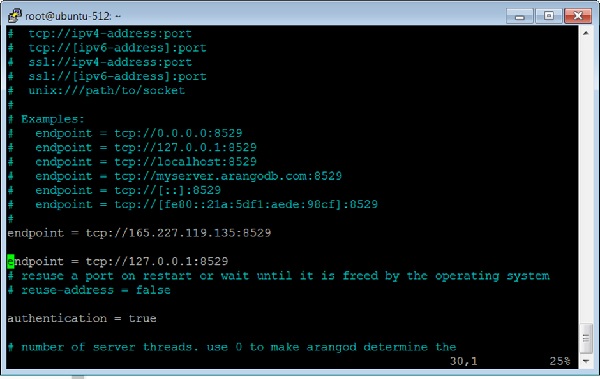
让我们添加另一个图,这次使用Arangosh。为此,我们需要在ArangoDB配置文件中包含另一个端点。
如何添加多个端点
打开配置文件−
# vim /etc/arangodb3/arangod.conf
添加另一个端点,如下面的终端屏幕截图所示。
重新启动ArangoDB-
# service arangodb3 restart
启动Arangosh−
# arangosh
Please specify a password:
_
__ _ _ __ __ _ _ __ __ _ ___ ___| |__
/ _` | '__/ _` | '_ \ / _` |/ _ \/ __| '_ \
| (_| | | | (_| | | | | (_| | (_) \__ \ | | |
\__,_|_| \__,_|_| |_|\__, |\___/|___/_| |_|
|___/
arangosh (ArangoDB 3.1.27 [linux] 64bit, using VPack 0.1.30, ICU 54.1, V8
5.0.71.39, OpenSSL 1.0.2g 1 Mar 2016)
Copyright (c) ArangoDB GmbH
Pretty printing values.
Connected to ArangoDB 'http+tcp://127.0.0.1:8529' version: 3.1.27
[server], database: '_system', username: 'root'
Please note that a new minor version '3.2.2' is available
Type 'tutorial' for a tutorial or 'help' to see common examples
127.0.0.1:8529@_system>
社会关系图
现在让我们来了解什么是社会关系图以及它是如何工作的。这张图显示了一组人及其关系−
本例将女性和男性作为两个顶点集合(女性和男性)中的顶点。边是它们在关系边集合中的连接。我们已经描述了如何使用Arangosh创建这个图。读者可以围绕它工作并探索它的属性,就像我们使用图所做的那样。
