笔记列表:
高级Excel-温度计图表
温度表是一个可视化的实际值定义明确的措施,例如,任务状态相比,一个目标值。这是一个线性版本的规格图,你将在下一章学习。
你可以用一个简单的上升温度表来跟踪你在一段时间内的进度。
体温表是什么?
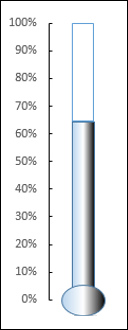
温度表跟踪单个任务,例如工作的完成情况,表示与目标相比的当前状态。它显示任务完成的百分比,目标为100%。
温度计图表如下所示。
温度计图的优点
温度计图表可用于跟踪任何实际值与目标值(完成百分比)的比较。它只使用一个值,是一个很有吸引力的图表,可以包含在仪表板中,对实现的百分比、与目标销售目标的绩效百分比、利润百分比、工作完成百分比、预算利用率等进行快速直观的影响。
如果您有多个值来跟踪实际值和目标值,您可以使用项目符号图,这将在后面的章节中学习。
数据准备
按以下方式准备数据−
-
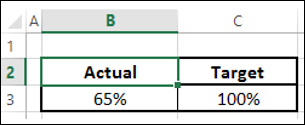
以实际值与目标值的百分比计算实际值。
-
目标应始终为100%。
-
将数据放在下表中。
创建温度计图表
以下是创建温度计图表的步骤−
第一步 − Select the data.
第2步 − Insert a Clustered Column chart.
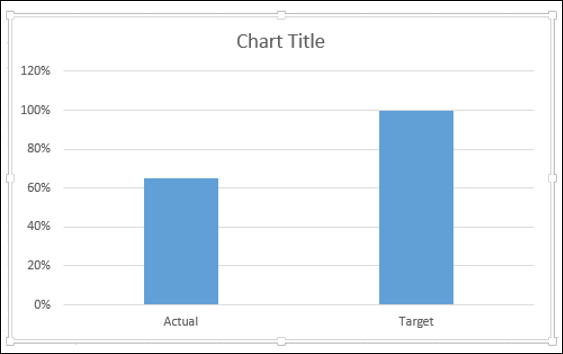
如您所见,右边的列是Target。
第3步 − Click on a Column in the chart.
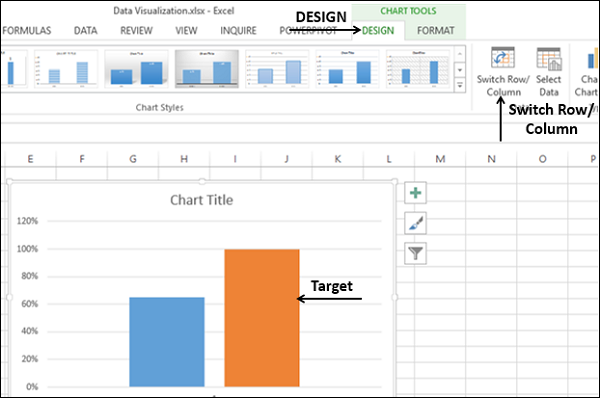
第4步 − Click the DESIGN tab on the Ribbon.
第5步 − Click the Switch Row/ Column button.
第6步 − Right click on the Target Column.
第7步 − Select Format Data Series from the dropdown list.
第8步 − Click on Secondary Axis under SERIES OPTIONS in the Format Data Series pane.
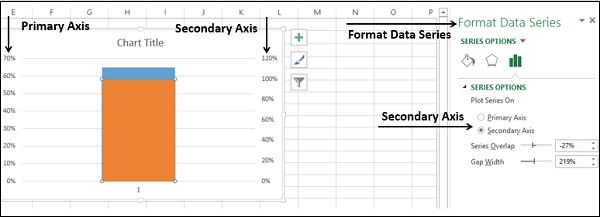
如您所见,主轴和次轴具有不同的范围。
第9步 − Right click on the Primary Axis. Select Format Axis from the dropdown list.
第10步 − Type the following in Bounds under AXIS OPTIONS in the Format Axis pane −
- 最小值为0。
- 最大值为1。
对次轴重复上述步骤,将边界更改为0和1。
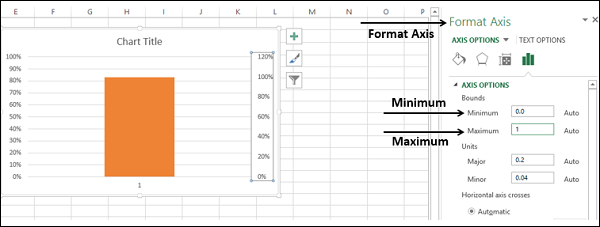
主轴和副轴都将设置为0%-100%。
如您所见,目标列隐藏了实际列。
第11步 − Right click on the visible Column, i.e. Target.
步骤12 − Select Format Data Series from the dropdown list.
在“数据系列格式”窗格中,选择以下选项−
- “填充”选项下没有填充。
- 边框下的实线选项。
- 颜色选项下为蓝色。
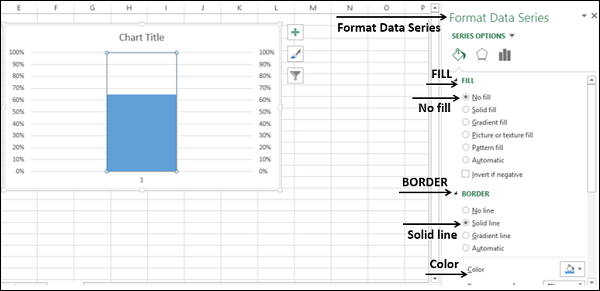
步骤13 − In Chart Elements, deselect the following −
- 轴线→ 初级水平。
- 轴线→ 次要垂直方向。
- 网格线。
- 图表标题。
第14步 − Right click on the Primary Vertical Axis.
步骤15 − Select Format Axis from the dropdown list.
第16步 − Click TICK MARKS under the AXIS OPTIONS in the Format Axis pane.
第17步 − Select the option Inside for Major type.
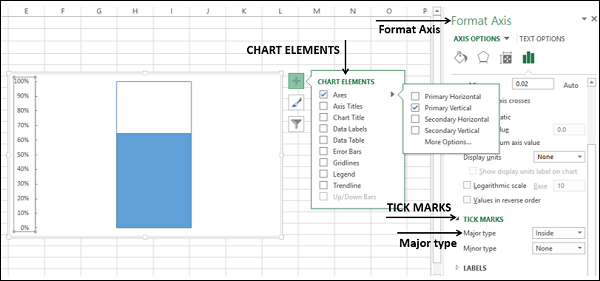
第18步 − Right click on the Chart Area.
第19步 − Select Format Plot Area from the dropdown list.
步骤20 − Click Fill & Line in the Format Plot Area pane. Select the following −
- “填充”选项下没有填充。
- 边界下没有行选项。
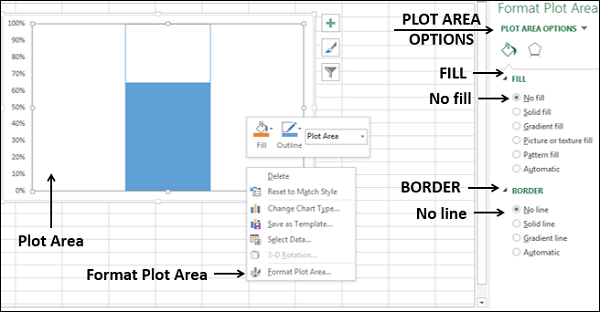
第21步 − Resize the Chart Area to get the Thermometer shape for the chart.

你拿到了体温表,上面显示了实际值和目标值。
第22步 − You can make this Thermometer chart more appealing with some formatting.
- 在图表中插入与蓝色矩形部分重叠的矩形形状。
- In the Format Shape options, select the following −
- 渐变填充填充。
- 线性类型。
- 角度为1800。
- 将渐变停止设置为0%、50%和100%。
- 对于0%和100%的渐变停止,选择黑色。
- 对于50%的渐变停止,选择白色。
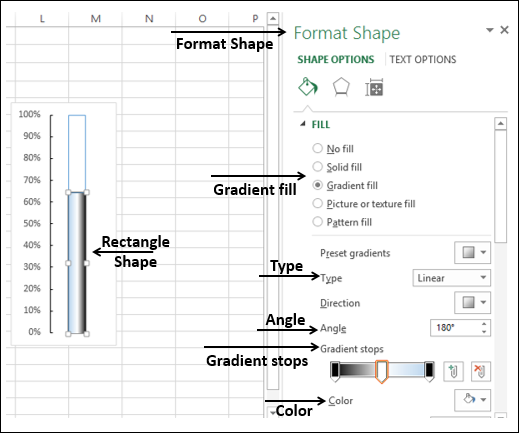
- 在底部插入椭圆形。
- 使用与矩形相同的选项设置椭圆形的格式。
- 结果如下所示−

你的体温表准备好了。这在仪表板上或作为演示文稿的一部分会很好看。
